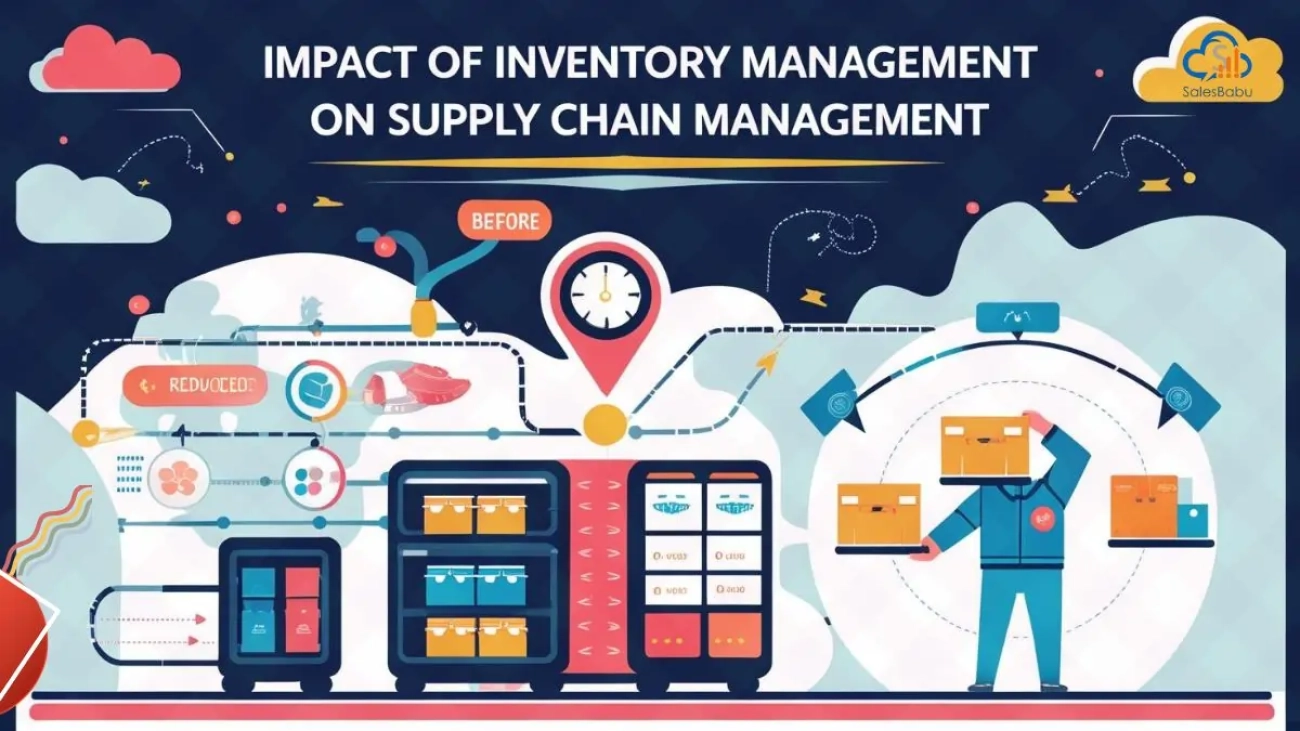
Role of Effective Warehouse Management in Supply Chain Operations
in Bringing Value to Organizational Performance (OTP Framework Perspective)
In many organizations, the warehouse is misunderstood as a storage space. In reality:
A warehouse is a movement and value-creation center.
It directly impacts:
- Cost
- Service level
- Speed
- Accuracy
- Customer satisfaction
At Talent Consultancy, we emphasize a powerful truth:
“Warehouse performance does not just affect operations—it determines business performance.”
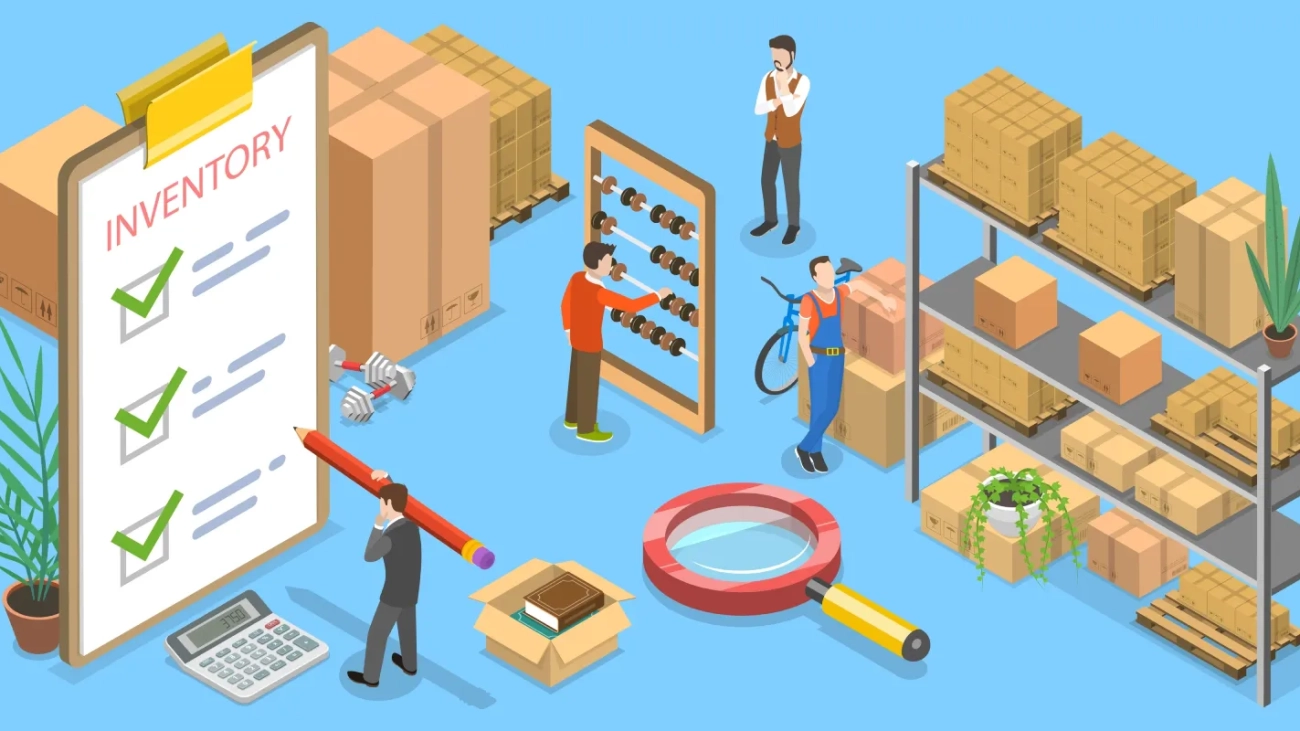
1. Understanding Warehouse Management
Warehouse management involves:
- Receiving goods
- Storing inventory
- Managing stock
- Picking and packing orders
- Dispatching products
Objective:
Right Product + Right Quantity + Right Time + Right Condition + Minimum Cost
2. Key Functions of Warehouse Operations
1. Receiving
Activities:
- Unloading goods
- Verifying quantity and quality
- Recording inventory
Value Contribution:
- Prevents incorrect stock entry
- Reduces supplier-related errors
2. Storage
Activities:
- Proper placement of goods
- Space utilization
- Inventory classification
Value Contribution:
- Optimizes space
- Improves accessibility
- Reduces handling time
3. Inventory Control
Activities:
- Stock monitoring
- Cycle counting
- Maintaining stock accuracy
Value Contribution:
- Prevents stockouts and overstocking
- Improves working capital
4. Order Picking
Activities:
- Selecting items for orders
Value Contribution:
- Direct impact on accuracy and speed
- Reduces errors and returns
5. Packing
Activities:
- Preparing goods for delivery
- Ensuring proper packaging
Value Contribution:
- Prevents damage
- Improves customer satisfaction
6. Dispatch
Activities:
- Shipping goods
- Coordinating transportation
Value Contribution:
- Ensures timely delivery
- Improves service level
3. Key Warehouse Performance Drivers
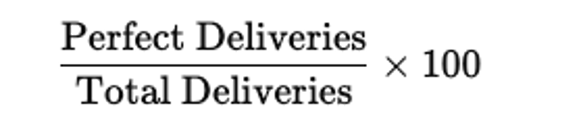
1. Accuracy
- Order picking accuracy
- Inventory accuracy
Impact:
- Fewer errors
- Reduced returns
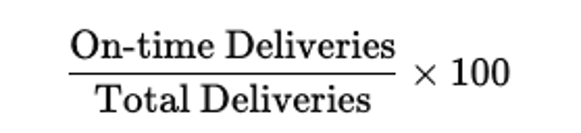
2. Speed
- Order processing time
- Picking time
Impact:
- Faster delivery
- Improved service level
3. Efficiency
- Labor productivity
- Space utilization
Impact:
- Lower operational cost
4. Cost Control
- Labor cost
- Storage cost
- Handling cost
Impact:
- Improved profitability
5. Safety and Quality
- Safe handling
- Damage prevention
Impact:
- Reduced losses
- Better product quality
4. Common Warehouse Problems
- Poor layout
- Low inventory accuracy
- High picking errors
- Inefficient labor use
- Lack of monitoring
- Poor coordination with logistics
Result:
- High cost
- Delays
- Customer dissatisfaction
- Reduced profit
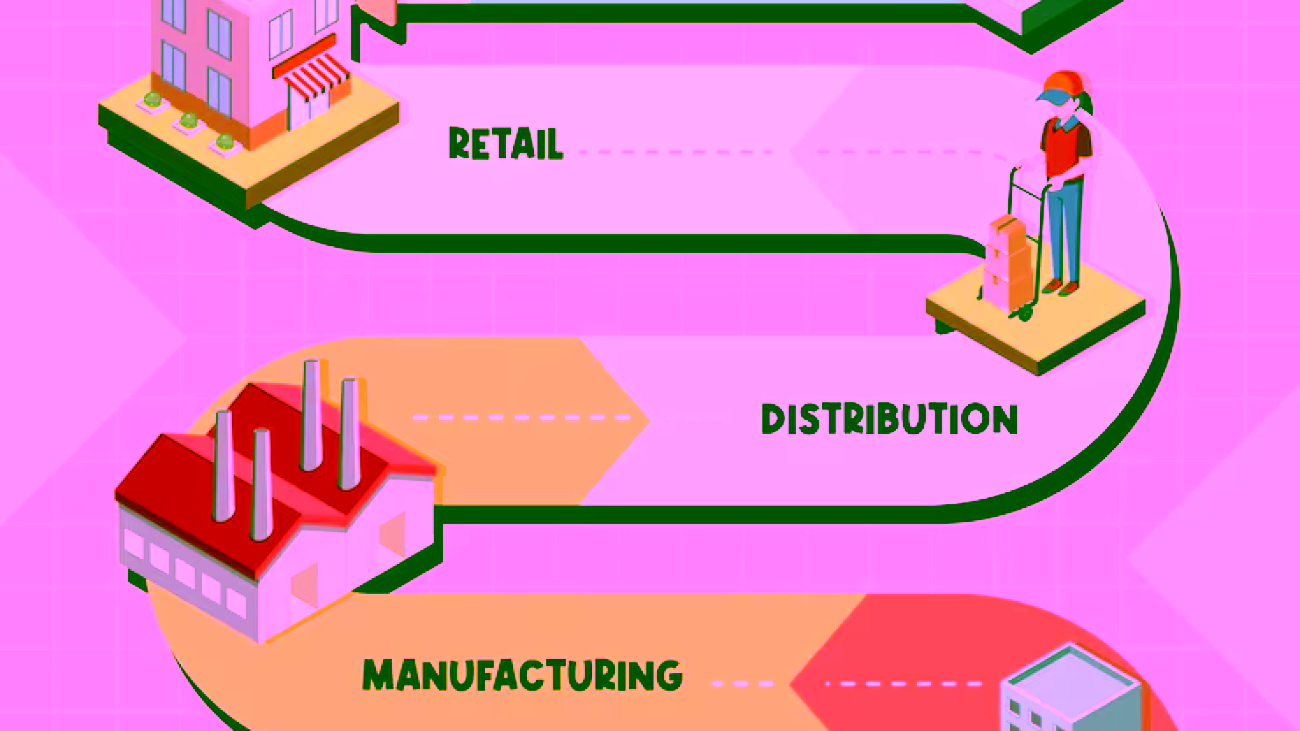
5. Linking Warehouse Management to Supply Chain Operations
Warehouse connects:
- Procurement (incoming goods)
- Inventory (stock control)
- Logistics (outbound delivery)
- Customer service (order fulfillment)
So:
Warehouse → Supply Chain → Operations → Performance → Profit
6. Linking Warehouse Management to OTP Framework
OTP Framework
Operations → Visibility → Accountability → Control → Profit
Warehouse performance improves only through OTP.
7. Warehouse Management Through OTP Framework
1. Visibility (Understanding Warehouse Operations)
Organizations must track:
- Inventory levels
- Order status
- Picking accuracy
- Processing time
Tools:
- Warehouse Management Systems (WMS)
- KPI dashboards
Impact:
- Real-time visibility
- Better decision-making
OTP Link
Visibility → Operational Clarity → Better Management
2. Accountability (Ownership of Warehouse Performance)
Responsibilities must be clearly defined:
| Area | Responsible |
| Receiving | Receiving supervisor |
| Inventory | Inventory controller |
| Picking | Warehouse team |
| Dispatch | Logistics coordinator |
Impact:
- Responsibility
- Ownership
- Improved performance
OTP Link
Visibility → Accountability → Ownership
3. Control (Managing Warehouse Operations)
Organizations must:
- Monitor KPIs
- Control processes
- Improve layout
- Train employees
- Implement SOPs
Examples:
- Reduce picking errors
- Optimize storage
- Improve workflow
Impact:
- Efficiency
- Cost reduction
- Service improvement
OTP Link
Accountability → Control → Operational Excellence
4. Profit (Outcome of Effective Warehouse Management)
When warehouse operations are effective:
- Costs reduce
- Efficiency improves
- Errors decrease
- Delivery speed increases
- Customer satisfaction improves
- Profitability increases
8. Comprehensive Value Contribution of Warehouse
| Area | Value Created |
| Cost | Reduced handling & storage cost |
| Service | Faster and accurate delivery |
| Inventory | Better control and availability |
| Quality | Reduced damage |
| Efficiency | Improved productivity |
| Customer | Higher satisfaction |
9. Practical Business Example
Situation:
High order errors and delayed deliveries
Weak Warehouse Management:
- Poor layout
- No KPI tracking
- No accountability
Result:
- High returns
- Customer complaints
- Increased cost
Strong Warehouse Management (OTP):
Visibility
- Track order accuracy
Accountability
- Assign responsibility to picking team
Control
- Improve picking process
Result:
- Reduced errors
- Faster delivery
- Lower cost
- Improved customer satisfaction
- Higher profit
10. Key Strategies for Effective Warehouse Management
- Implement WMS
- Optimize warehouse layout
- Train staff
- Improve inventory accuracy
- Use automation where possible
- Monitor KPIs
- Improve coordination with logistics
- Focus on continuous improvement
11. Complete Performance Logic
Effective Warehouse Management
→ Supply Chain Operations
→ Visibility
→ Accountability
→ Control
→ Efficiency + Accuracy + Cost Reduction
→ Customer Satisfaction
→ Revenue
→ Profit
→ Business Performance
Final Strategic Thought
Many organizations underestimate the warehouse, but it is one of the most critical components in the supply chain. It directly affects cost, service, and efficiency.
At Talent Consultancy, we emphasize that warehouse management is not about storage—it is about value creation through visibility, accountability, and control.
Final Powerful Statement
Warehouse is not a storage place – It is a performance center. And business performance improves only when warehouse operations are visible, accountable, and controlled.