SUPPLY CHAIN KPI FRAMEWORK (END-TO-END)
Supply Chain Components:
- Demand Planning
- Procurement / Sourcing
- Inventory Management
- Logistics / Distribution
- Operations (Restaurant Execution)
1. Demand Planning KPIs
Goal: Predict customer demand accurately
1. Forecast Accuracy %
Formula:
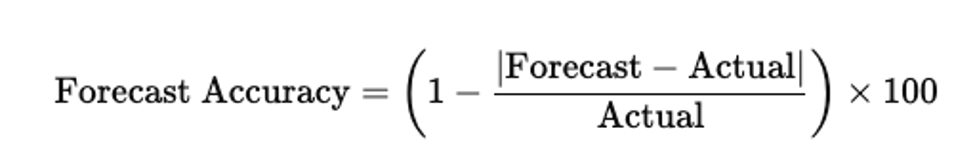
Example (McDonald’s):
- Forecast burgers = 1,000
- Actual demand = 1,200
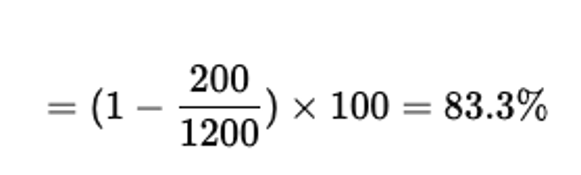
Use:
- Low accuracy → stockouts or waste
- High accuracy → balanced inventory
2. Demand Variability
Formula:
Standard deviation of demand
Use:
- High variability → need higher safety stock
- Low variability → lean inventory
2. Procurement / Sourcing KPIs
Goal: Ensure cost efficiency + availability
1. Supplier On-Time Delivery %
Formula:
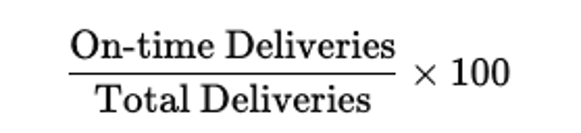
Example:
- Deliveries = 100
- On-time = 95
→ 95%
Use:
Late deliveries =
→ kitchen delays → slow service
2. Cost per Unit
Formula:

Example:
- AED 50,000 spent
- 10,000 units
→ AED 5 per unit
Insight:
Lower cost must NOT reduce quality
(Otherwise waste & service time increase)
3. Supplier Defect Rate %
Formula:
Use:
Poor quality →
→ higher waste
→ slower kitchen operations
3. Inventory Management KPIs
Goal: Balance availability vs cost
1. Inventory Turnover
Formula:

Example:
- Monthly food usage = AED 30,000
- Inventory = AED 5,000
→ Turnover = 6 times/month
Use:
- High turnover → efficient
- Low turnover → overstock
2. Days of Inventory
Formula:

Example:
- Inventory = AED 5,000
- Daily usage = AED 1,000
→ 5 days
Use:
Too high → waste risk
Too low → stockout risk
3. Stock Availability %
Formula:
Example:
98 out of 100 items available → 98%
Use:
Low availability → lost sales
4. Logistics / Distribution KPIs
Goal: Deliver right product at right time
1. On-Time In-Full (OTIF)
Formula:
Example:
- Deliveries = 50
- Perfect = 45
→ 90%
Use:
Low OTIF →
→ delays
→ incomplete stock
2. Transportation Cost %
Formula:
Example:
- Transport = AED 2,000
- Sales = AED 20,000
→ 10%
Use:
Too high → margin pressure
3. Delivery Lead Time
Formula:
Time from order to delivery
Use:
Long lead time →
→ higher safety stock
5. Operations (Restaurant Execution KPIs)
Goal: Convert supply chain into revenue
1. Service Time
(Already discused
2. Waste %
3. Throughput
Customers served per hour
4. Labor Productivity

FULL CASE STUDY (Integrated View)
Scenario:
Demand underestimated.
Impact Across Supply Chain:
Demand Planning
- Forecast accuracy = 80%
Procurement
- Insufficient stock ordered
Inventory
- Stockout occurs
Logistics
- Emergency delivery (high cost)
Operations
- Service time increases
- Customers leave
Financial Impact:
- Lost sales
- Increased logistics cost
- Lower customer satisfaction
CRITICAL INSIGHT (Your Authority Line)
“Supply chain KPIs are not isolated. They are interconnected drivers of profit.”
Supply Chain KPIs Through OTP Framework
(Visibility → Accountability → Control → Profit)
Instead of listing KPIs randomly, you position them as a system of execution discipline.
1️.VISIBILITY – “Can you see the problem early?”
Purpose:
Real-time understanding of supply chain performance
Key KPIs (Visibility)
Demand Planning
- Forecast Accuracy %
- Demand Variability
Procurement
- Supplier On-Time Delivery %
- Supplier Defect Rate %
Inventory
- Stock Availability %
- Days of Inventory
Logistics
- OTIF (On-Time In-Full)
Operations
- Service Time
- Waste %
- Throughput
McDonald’s Example:
- Forecast accuracy drops from 95% → 80%
- Dashboard shows mismatch
👉 Immediate signal:
Demand is not aligned with supply
Insight:
Visibility is not reports.
It is early warning.
2️.ACCOUNTABILITY – “Who owns the KPI?”
🎯 Purpose:
Clear ownership of every performance metric
KPI Ownership Mapping
| KPI | Owner |
| Forecast Accuracy | Demand Planner |
| Supplier Delivery | Procurement Manager |
| Inventory Levels | Store Manager |
| OTIF | Logistics Manager |
| Service Time | Shift Supervisor |
| Waste % | Kitchen Lead |
McDonald’s Example:
Stockout happens.
They don’t ask:
“What happened?”
They ask:
“Who owns this KPI?”
Insight:
No owner = No correction
3️.CONTROL – “Can you act immediately?”
🎯 Purpose:
Convert visibility into action
Control KPIs (Real-Time Management)
- Service Time (minute-by-minute)
- Waste % (hourly monitoring)
- Inventory levels (daily check)
- Delivery delays (instant escalation)
McDonald’s Example:
Problem:
Delivery delay of burger buns
Action:
- Activate backup supplier
- Adjust menu mix
- Reallocate stock between branches
No waiting for next week review
Insight:
Control = Speed of decision-making
4️.PROFIT – “What is the financial impact?”
Purpose:
Link every KPI to money
Profit-Linked KPIs
- Waste % → Cost loss
- Service Time → Revenue opportunity
- Labor % → Margin control
- Inventory Turnover → Cash flow
- Transport Cost % → Profit erosion
McDonald’s Example:
Waste reduced:
6% → 4%
Daily saving = AED 200
Monthly = AED 6,000
Insight:
Every KPI must speak in currency
Integrated Supply Chain Example (OTP in Action)
Scenario:
Forecast Accuracy drops
Visibility:
Dashboard shows demand mismatch
Accountability:
Demand planner responsible
Control:
- Adjust procurement orders
- Increase safety stock
- Align kitchen production
Profit Impact:
- Avoid stockout → protect revenue
- Reduce overstock → reduce waste
Your Signature Insight (Very Powerful)
Most companies measure KPIs.
Few connect them through a system.
OTP connects KPIs into execution.
Common Corporate Mistake
- Visibility → Monthly reports
- Accountability → Unclear
- Control → Delayed
- Profit → Not measured
Result:
Supply chain inefficiency.