Forecasting Techniques Explained in Detail
(With Practical Examples for Complete Understanding | OTP Framework Perspective)
Many professionals know forecasting methods—but struggle to apply them in real business situations.
Because:
Understanding forecasting is not about formulas—it is about choosing the right method for the right situation.
At Talent Consultancy, we emphasize:
“Forecasting becomes powerful only when it is understood, applied, and linked to decisions.”
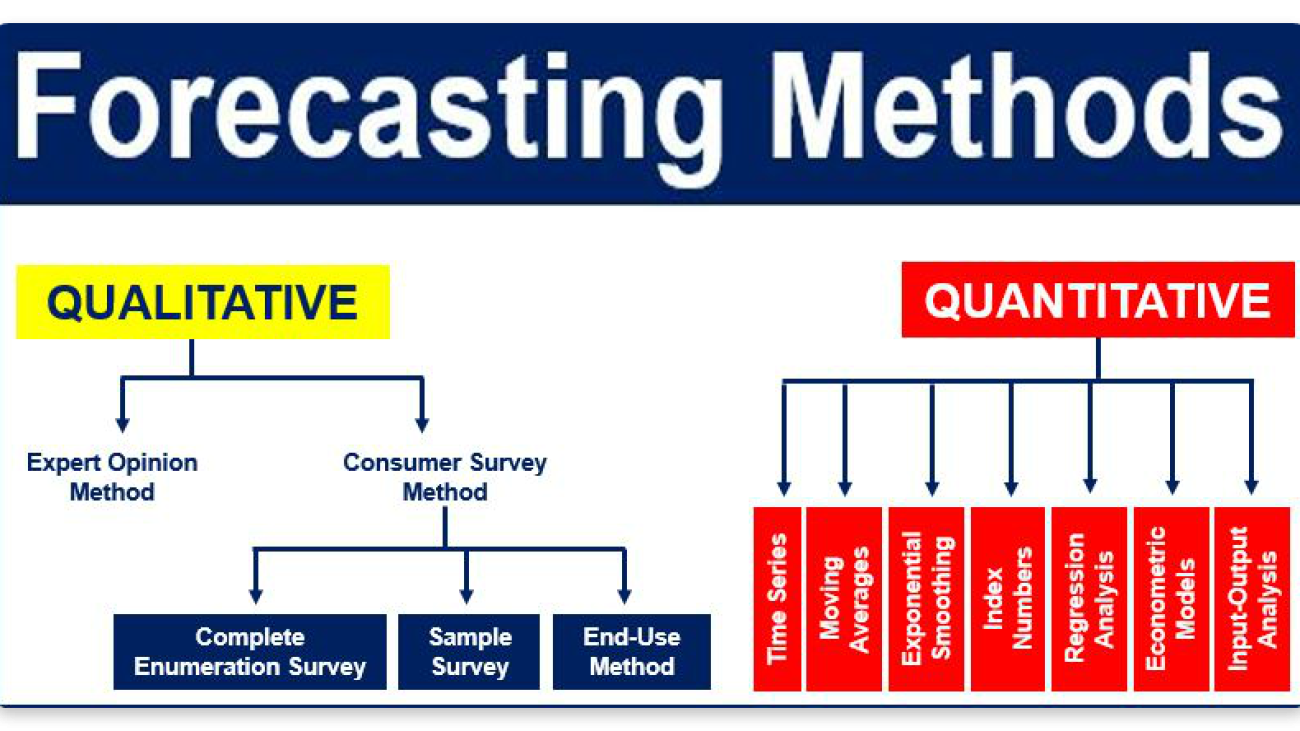
1. Qualitative Forecasting (Judgment-Based Methods)
What It Is:
Forecast based on:
- Experience
- Expert opinion
- Market insights
Used when:
- No historical data exists
- New products or markets
Techniques Explained
1. Delphi Method
How It Works:
- Multiple experts give opinions
- Responses are collected anonymously
- Refined over several rounds
Example:
A company launching a new beverage asks 5 industry experts:
- Expert 1: 10,000 units/month
- Expert 2: 12,000
- Expert 3: 11,000
Final consensus ≈ 11,000 units
Business Use:
- Strategic decisions
- Long-term planning
Strength:
- Reduces bias
Limitation:
- Time-consuming
2. Market Research Method
How It Works:
- Surveys customers
- Collects demand insights
Example:
Survey results:
- 60% customers interested in a new product
Estimated demand = 6,000 units out of 10,000 target customers
Business Use:
- Product launch
- Market entry
Strength:
- Customer-driven
Limitation:
- May not reflect actual behavior
3. Sales Force Composite
How It Works:
- Sales team provides demand estimates
Example:
Regional forecasts:
- Region A: 5,000
- Region B: 3,000
- Region C: 2,000
Total forecast = 10,000 units
Business Use:
- Short-term sales planning
Strength:
- Based on real market interaction
Limitation:
- Can be biased
Key Insight:
Qualitative methods are useful when data is unavailable—but require experience and judgment
2. Time Series Forecasting (Historical Data-Based)
What It Is:
Uses past data to predict future demand
Used when:
- Historical data is available
- Demand patterns are stable
Techniques Explained
1. Moving Average Method
How It Works:
Average of past data over a period
Example:
Sales:
- Jan = 1,000
- Feb = 1,200
- Mar = 1,100
Forecast for April:
= (1000 + 1200 + 1100) / 3
= 1,100 units
Business Use:
- Inventory planning
Strength:
- Simple
Limitation:
- Ignores trends
2. Weighted Moving Average
How It Works:
Recent data is given more importance
Example:
Weights:
- Jan = 20%
- Feb = 30%
- Mar = 50%
Forecast:
= (1000×0.2) + (1200×0.3) + (1100×0.5)
= 200 + 360 + 550
= 1,110 units
Strength:
- More accurate than simple average
Limitation:
- Requires weight selection
3. Exponential Smoothing
How It Works:
- Uses previous forecast + actual demand
- Smoothens fluctuations
Example:
Formula:
New Forecast = Previous Forecast + α (Actual − Previous Forecast)
Assume:
- Previous forecast = 1,000
- Actual = 1,200
- α = 0.3
New forecast:
= 1000 + 0.3(1200 − 1000)
= 1000 + 60
= 1,060 units
Strength:
- Adapts to changes
Limitation:
- Requires parameter tuning
4. Trend Analysis
How It Works:
Identifies upward or downward trends
Example:
Sales:
- Jan = 1,000
- Feb = 1,100
- Mar = 1,200
Increasing trend → Forecast April ≈ 1,300 units
Strength:
- Captures growth
Limitation:
- Ignores seasonality
Key Insight:
Time series methods rely on past patterns to predict future demand
3. Causal Forecasting (Cause-Effect Relationship)
What It Is:
Forecast based on factors influencing demand
Factors:
- Price
- Promotions
- Economic conditions
Example:
- Normal demand = 1,000 units
- Promotion increases sales by 30%
Forecast:
= 1,000 + 30%
= 1,300 units
Business Use:
- Marketing campaigns
- Pricing decisions
Strength:
- More realistic
Limitation:
- Complex analysis
Key Insight:
Demand is driven by external factors—not just past data
4. Collaborative Forecasting (Integrated Planning)
What It Is:
Forecast created with multiple stakeholders
Participants:
- Sales
- Marketing
- Operations
- Suppliers
Example:
- Sales forecast = 10,000 units
- Marketing expects promotion → +2,000
- Final forecast = 12,000 units
Business Use:
- Supply chain coordination
Strength:
- Improves accuracy
Limitation:
- Requires coordination
Key Insight:
Collaboration reduces forecasting errors
5. When to Use Each Method (Practical Guide)
| Situation | Best Method |
| New product | Qualitative |
| Stable demand | Moving average |
| Recent trends important | Weighted / Exponential |
| Growth pattern | Trend analysis |
| External factors influence demand | Causal |
| Complex supply chain | Collaborative |
6. Linking Forecasting to OTP Framework
Visibility
- Forecast shows future demand
Accountability
- Planner responsible for accuracy
Control
- Adjust supply chain decisions
Profit
- Reduce cost and improve service
7. Complete Performance Logic
Forecasting
→ Demand Visibility
→ Planning
→ Accountability
→ Control
→ Efficient Operations
→ Reduced Cost
→ Improved Service
→ Revenue
→ Profit
→ Business Performance
8. Points to Remember
1. No Single Method is Perfect
- Choose based on situation
2. Accuracy Improves with Data and Experience
3. Forecast Must Be Monitored and Updated
4. Collaboration Improves Reliability
5. Forecasting Drives Supply Chain Performance
Final Strategic Thought
Forecasting is not just a technical process—it is a strategic tool that connects demand with supply. The right method, applied correctly, can transform supply chain performance.
At Talent Consultancy, we emphasize that organizations must build forecasting capability as a core competency to drive visibility, accountability, and control in supply chain operations.
Final Powerful Statement
“Forecasting is not about guessing the future –It is about preparing for it. And business performance improves when organizations make informed decisions before demand happens.”